
1. Vorbedingungen
Javascript muss – so weit ich das ausprobiert habe – in html eingebettet sein. Eine reine Javascriptdatei xxx.js zu debuggen habe ich persönlich nicht hinbekommen.
Die html Datei mit eingebetteten Javascript sieht zum Beispiel wie folgt aus:
<html>
<head>
<title>JavaScript</title>
</head>
<body>
<script type="text/javascript">
var i1 = 15;
var i2 = 17;
var i3 = 0;
var i4 = 0;
var i5 = 0;
i3 = i1 + i2;
i4 = i1 * i2;
i5 = i1/i2;
</script>
</body>
</html>
Ich empfehle, eine html Datei zu verwenden, die auf eine Javascript Datei verweist:
Hier ein Beispiel für eine html Datei, die auf eine Javascript Datei verweist:
<html>
<head>
<title>JavaScript</title>
</head>
<body>
<script src="Test_01.js"></script>
</body>
</html>
Test_01.js steht hier im Beispiel im gleichen Verzeichnis wie die html Datei:
var i1 = 15;
var i2 = 17;
var i3 = 0;
var i4 = 0;
var i5 = 0;
i3 = i1 + i2;
i4 = i1 * i2;
i5 = i1/i2;
2. Debugger in Chrome starten
- html Datei in Chrome öffnen
- Im Chrome Menü rechts oben –> Weitere Tools –> Enwicklertools (oder STRG + UMSCHALT + I)
- Tab Source, Test_01.js wählen
- Breakpoint setzen, indem man mit der linken Maustaste links auf die Zeilennummer klickt.
- Wichtig!!!!: CTRL R drücken, damit Debuggen gestartet wird.
3. Arbeiten mit dem Debugger
Quelle: https://developer.chrome.com/devtools/docs/javascript-debugging
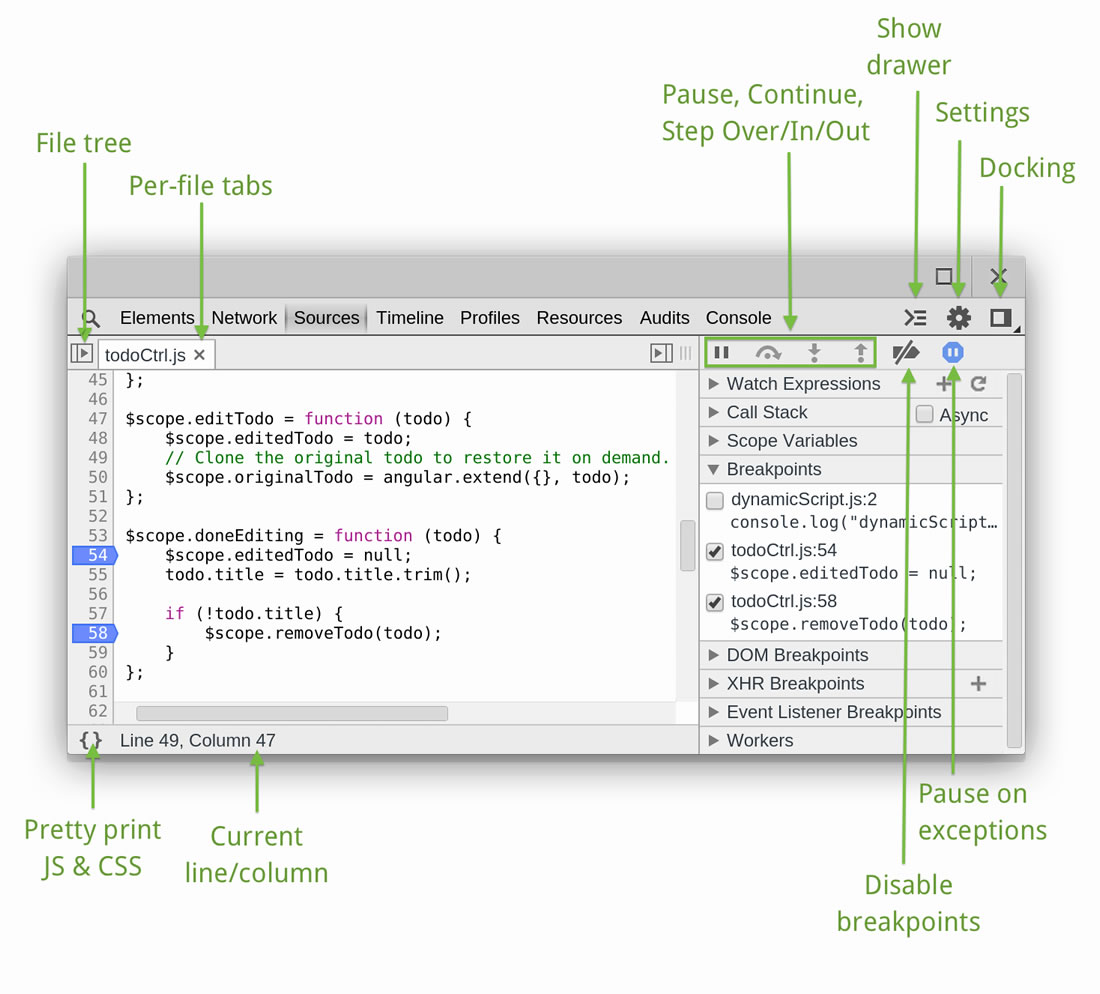
Execution control
The execution control buttons are located at the top of the side panels and allow you to step through code. The buttons available are:
 Continue: continues code execution until we encounter another breakpoint.
 Step over: step through code line-by-line to get insights into how each line affects the variables being updated. Should your code call another function, the debugger won’t jump into its code, instead stepping over so that the focus remains on the current function.
 Step into: like Step over, however clicking Step into at the function call will cause the debugger to move its execution to the first line in the functions definition.
 Step out: having stepped into a function, clicking this will cause the remainder of the function definition to be run and the debugger will move its execution to the parent function.
 Toggle breakpoints: toggles breakpoints on/off while leaving their enabled states intact.
There are also several related keyboard shortcuts available in the Sources panel:
- Continue: F8 or Command + \ on Mac or Ctrl + \ on other platforms.
- Step over: F10 or Command+' on Mac or Ctrl+' on other platforms.
- Step into: F11 or Command+; on Mac or Ctrl+; on other platforms.
- Step out: Shift+F11 or Shift+Command+; on Mac or Shift+Ctrl+; on other platforms.
- Next call frame: Ctrl+. on all platforms.
- Previous call frame: Ctrl+, on all platforms.
Wichtige Tastaturbefehle
- Pause (F8): Dies stoppt das Skript bei der nächsten JavaScript-Funktion und ermöglicht das Debuggen an dieser Stelle.
- Resume (F8): Lässt das JavaScript weiterlaufen und stoppt am nächstem Breakpoint. Nur verfügbar wenn das JavaScript bereits angehalten ist.
- Step over (F10): Überspringt einen Funktionsaufruf und geht direkt in die nächste Zeile.
- Step into (F11): Springt in einen Funktionsaufruf.
- Step out (Shift + F11): Springt aus einer Funktion heraus und geht wieder in die aufrufende Funktion.
4. Weitere Links
https://developer.chrome.com/devtools/docs/javascript-debugging
http://www.sgalinski.de/news/javascript-im-google-chrome-debuggen.html